Overview
As part of a NUS Software Engineering project, my group and I built Drink I/O, a one-stop, comprehensive inventory manager for small drink distribution companies. Drink I/O enables these companies to keep track of their inventory and analyse their sales performance, and hence increase their productivity.
Drink I/O is optimised for Command Line Interface (CLI), with a Graphic User Interface (GUI) to make it easier for users to interact with the app. It is written in Java, and has about 10kLoC.
This project portfolio documents my contributions to the project, in particular the major feature I made: the sales performance analyser feature.
Summary of contributions
-
Major feature implemented: Feature to analyse cost, revenue and profit over specific time periods
-
What it does: Allows the user to calculate the overall cost, revenue and profit of the company over based on its transactions. The statistics can be calculated over the time periods of: a day, the past 7 days (including the current day), the past 30 days (including the current day).
-
Justification: This feature enables the accountants in a small company to calculate the company’s sales performance quickly. It also allows the company to keep track of its finances simultaneously with its inventory.
-
Highlights: This feature required the building of new classes to record the transactions: a
Transactionclass, and aTransactionListclass to hold theTransactions. I was also challenged to optimise the code by usingPredicates to filter the list of transactions by date andTransactionType. This filtered list of transactions is then used for the computation of the sales figures.
-
-
Code contributed: [Functional and test code]
-
Other contributions:
-
Morphing of existing model:
-
The original code base is for an address book. Hence, the fundamental model used has to be changed to suit Drink I/O. I morphed the model from that of a
Personto aDrink, and created the relevantDrinkattributes, such asPrice. -
Commands to buy and sell drinks did not exist in the original code base, but are necessary for an app for a drink distribution company. I implemented the
buyandsellcommands, which required an in-depth understanding of how theModelandLogiccomponents worked.
-
-
Minor feature implemented: Feature to edit the details of a drink in the inventory
-
This enables the user to edit the cost price, selling price and tags of a drink.
-
-
Project management:
-
Managed releases for Drink I/O:
v1.2andv1.3on GitHub
-
-
Community:
-
Contributions to the User Guide
This section showcases my contribution to the User Guide in relation to the sales performance analysis feature. The performance statistics that can be calculated are cost, revenue and profit, and they can be computed over specific time periods. |
Analysing Sales Performance
Drink I/O can calculate the overall cost, revenue and profit aggregated across all drinks, for various periods based on your list of transactions.
Indicating time period for analysis
You can indicate the time period for the analysis of overall sales figures.
|
Summary
|
The time periods available are:
-
within the current day
-
within the week (including current day)
-
within 30 days (including current day)
To indicate the time periods desired in your analysis, append one of the following period parameters to the end of the command:
-
-wfor a period of a week -
-mfor a period of 30 days
No parameter is required for analysis in the period of a day. See Viewing overall cost for concrete usage examples and step-by-step instructions.
Viewing overall cost
You can check the total costs incurred by your company, over a specified period.
|
Summary
|
Step by Step Instructions
-
To view the total costs incurred within the current day:
-
Enter
costsinto the command box -
Press enter
-
You should see the value of the total costs displayed in the results panel.
-
To view the total costs incurred within the past 7 days (inclusive of current day):
-
Enter
costs -winto the command box -
Press enter
-
You should see the value of the total costs incurred over the week displayed in the results panel.
-
To view the total costs incurred within the past 30 days (inclusive of current day):
-
Enter
costs -minto the command box -
Press enter
-
You should see the value of the total costs incurred over the past 30 days displayed in the results panel. The transactions list will also show the relevant transactions included in the analysis.
Viewing overall revenue
You can check the total revenue earned by your company, over a specified period.
|
Summary
|
Step by Step Instructions
To view the total revenue earned,
-
Enter
revenueinto the command box -
Append a desired period parameter
-
e.g.
-w,-m(see Indicating time period for analysis)
-
-
Press enter
You should see the value of the total revenue earned in the specified period displayed in the results panel. The transactions list will also show the relevant transactions included in the analysis.
Viewing overall profit
You can check the total profit earned by your company, over a specified period.
|
Summary
|
Step by Step Instructions
To view the total profit earned,
-
Enter
profitinto the command box -
Append a desired period parameter
-
e.g.
-w,-m(see Indicating time period for analysis)
-
-
Press enter
You should see the value of the total profit earned displayed in the results panel. The transactions list will also show the relevant transactions included in the analysis.
Contributions to the Developer Guide
Shown below are the sections I contributed to the Developer Guide in relation to the sales performance analysis feature. |
Analyses of costs, revenue and profit in the company over periods of time
Implementation
To facilitate the analyses of total profit, revenue and costs of the company over various periods of time,
transactions (sales and purchases) are logged using Transaction s.
They will be logged when the drink stock increases due to a purchase (TransactionType is PURCHASE),
or when they decrease due to a sale (TransactionType is SALE).
These transactions are stored into a list of transactions, in TransactionList.
Analyses are conducted in AnalysisManager, with the API exposed in Analysis.
The following operations are implemented for the analyses of profit, revenue and costs:
-
Analysis#analyseCost(AnalysisPeriodType period) -
Analysis#analyseRevenue(AnalysisPeriodType period) -
Analysis#analyseProfit(AnalysisPeriodType period)
The implementation of these operations are elaborated in the below sub-sections.
Indicating the analysis period with AnalysisPeriodType
AnalysisPeriodType is an enum class that denotes the period for analysis:
-
in the current day
-
within the past 7 days (including the current day)
-
within the past 30 days (including the current day)
These are indicated respectively as:
-
AnalysisPeriodType.DAY -
AnalysisPeriodType.WEEK -
AnalysisPeriodType.MONTH.
A user may enter an analysis command with additional time period parameters.
For the period of a day, no parameter is indicated.
For the period of 7 days, -w is appended to the command. (e.g. costs -w)
For the period of 30 days, -m is appended to the command. (e.g. costs -m)
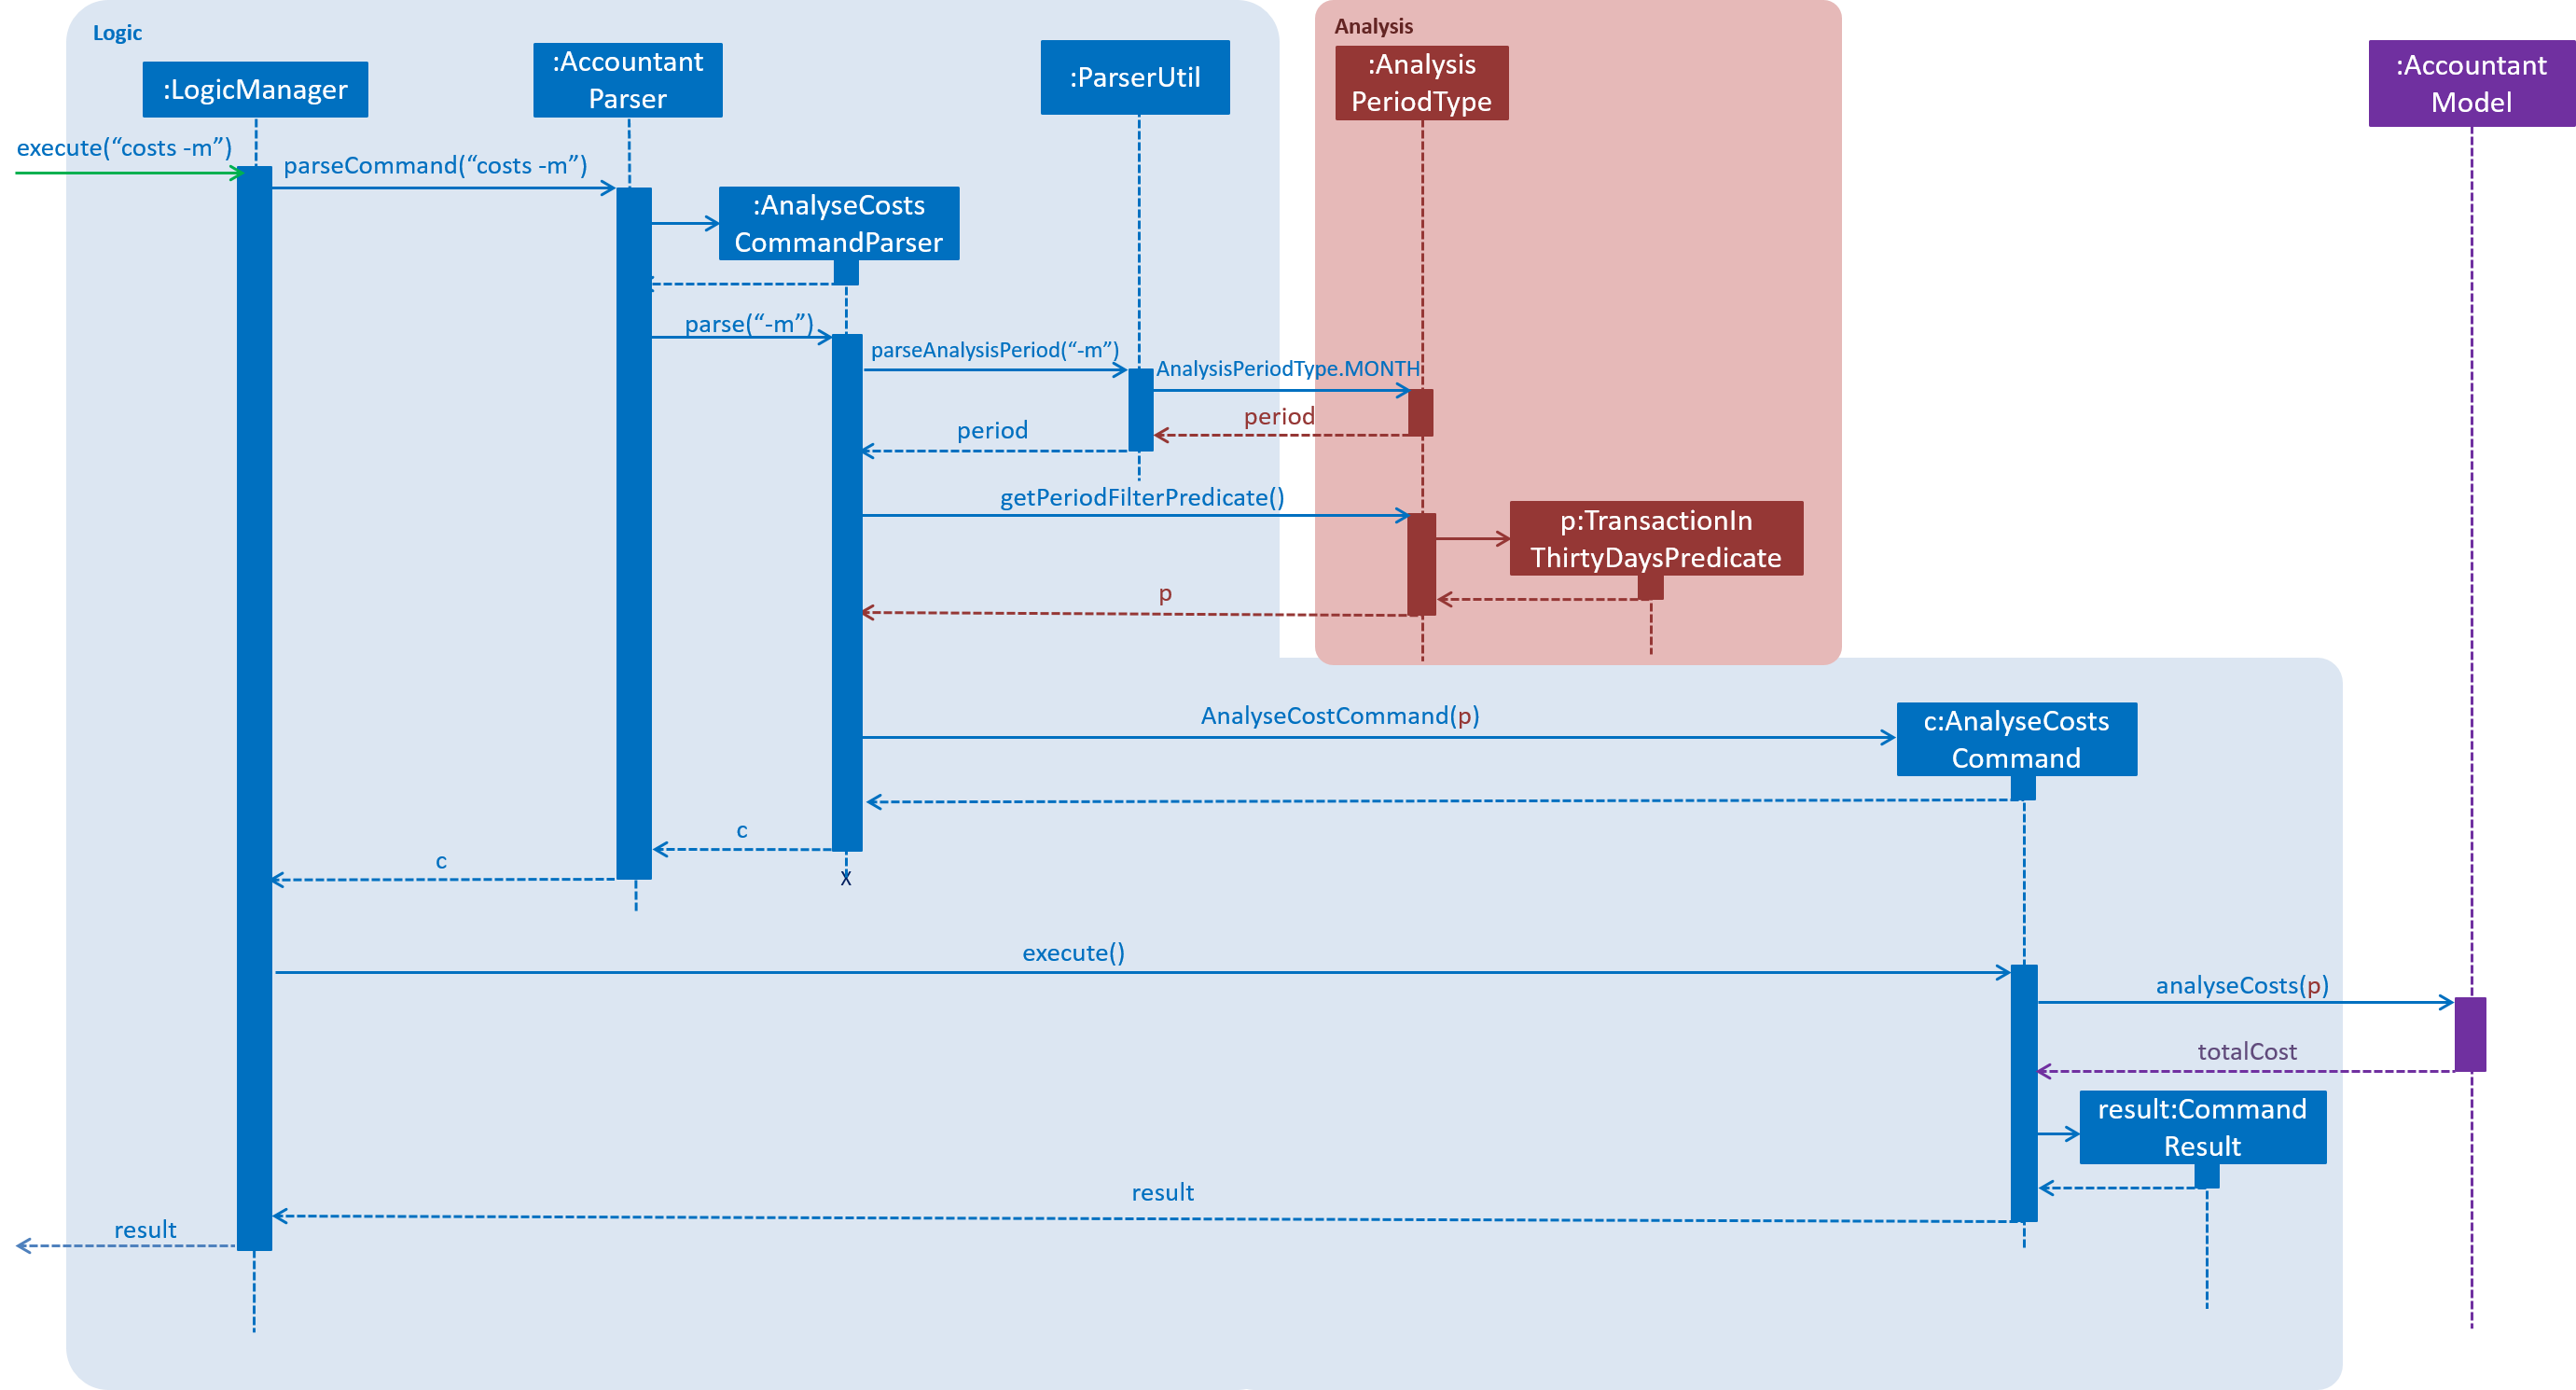
The following is the sequence of steps when the user enters an analysis command with a time period:
Step 1. User enters an analysis command (e.g. costs -m).
Step 2. The appropriate parser (e.g. AnalyseCostsCommandParser) parses the time period parameter,
and retrieves the AnalysisPeriodType value corresponding to the time period.
Step 3. The relevant TransactionPeriodPredicate for the AnalysisPeriodType value is retrieved. It is assigned to an Analysis Command (e.g. AnalyseCostsCommand).
The available TransactionPeriodPredicate s corresponding to each AnalysisPeriodType are:
-
DAY:TransactionInADayPredicate -
WEEK:TransactionInSevenDaysPredicate -
MONTH:TransactionInThirtyDaysPredicate
These are retrieved using AnalysisPeriodType#getPeriodFilterPredicate().
Step 4. The analysis command is executed, and the TransactionPeriodPredicate predicate is passed to the appropriate ModelManager.
This is done through the analyseCosts() method in the appropriate ModelManager.
Step 5. In the appropriate ModelManager (Accountant or Manager), the predicate is passed to the filtered transaction list.
This is in order to filter the transactions by their dates such that
the filtered transaction list only contains transactions with dates within the relevant period.
FilteredList<Transaction> handles the filtering using the given predicate.
The following sequence diagram shows how the first part of the AnalyseCostCommand works, as described above:
Implementation of Analysis#analyseCost()
The actual analysis of costs continues from the the filtering of the filtered transaction list. This section focuses on the actual computation of the costs incurred by the company.
Step 1. In addition to passing the analysis period Predicate, a PurchaseTransactionPredicate is
also passed to the filtered transaction list simultaneously.
This filters the list further, leaving only the TransactionType.PURCHASE transactions, which contribute
to the costs of the company.
Overall, the filtered transaction list will also be updated in the UI.
Step 2. ModelManager passes control to the AnalysisManager.
Step 3. In AnalysisManager, the helper method AnalysisManager#calculateTotalCost() is called
to compute the total costs of the filtered transactions.
It iterates through the filtered transaction list, and checks the Transaction 's TransactionType
as a precuation. If the TransactionType is PURCHASE, the amountMoney transacted is obtained and
added to a sum of costs. The sum of costs is then wrapped in a Price object and returned to the calling function.
Implementation of Analysis#analyseRevenue()
The implementation of the analysis of revenue is similar to that of costs. However, a SaleTransactionPredicate
is passed to the filtered transaction list instead.
In Step 3, the helper method AnalysisManager#calculateTotalRevenue() is called. It iterates
through the filtered transaction list, and checks if the Transaction 's TransactionType is
SALE. If so, the amountMoney transacted is added to the sum of revenues. The sum of revenues
is then wrapped in a Price object and returned to the calling function.
Implementation of Analysis#analyseProfit()
The analysis of profit continues from the filtering of the filtered transaction list by period. This section focuses on the actual computation of the profit earned by the company.
Step 1. ModelManager passes control to the AnalysisManager. No additional filtering is done.
Step 2. In AnalysisManager, the helper method AnalysisManager#calculateTotalProfit() is called
to compute the total profit of the filtered transactions.
It iterates through the filtered transaction list, and checks the Transaction 's TransactionType.
-
If the
TransactionTypeisPURCHASE, theamountMoneytransacted is obtained and added to a sum of costs. -
If the
TransactionTypeisSALE, theamountMoneytransacted is obtained and added to a sum of revenues.
Step 3. Total profit is calculated using the formula: "profit = revenue - cost". This total profit value is checked to determine whether it is negative.
-
If total profit is positive or zero, it is wrapped in a
Priceobject and returned to the calling function. -
If the total profit is negative, the absolute value is taken, and a special
NegativePriceobject is used to wrap the value. It is then returned to the calling function.-
NegativePriceis a sub-class ofPrice, and is used only when calculating profit. -
The
valueof theNegativePriceobject is the absolute value of the profit.
-
Design Considerations
Aspect: Filtering the transactions by date
-
Current implementation: Pass predicates to the filtered transaction list, before performing analyses using that list
-
Pros:
-
Extensible as more Predicates can be created and passed to the filtered transaction list to filter the transactions by different facets.
-
Enhances reusability especially of the
updateFilteredTransactionList(Predicate predicate)method. -
Allows the transaction list panel in the UI to be updated automatically.
-
-
Cons: We must ensure that the implementation of each Predicate is correct.
-
-
Alternative: Loop through all transactions in the
TransactionList, and check if the transaction date is within the desired time period-
Pros: Easy to implement.
-
Cons: May have time performance issues if there are many transactions.
-